
Bat Acoustic Monitoring
Visualization Tool(a companion to BatAMP)

Acoustic Monitoring
is essential for helping study and conserve bats in North America.
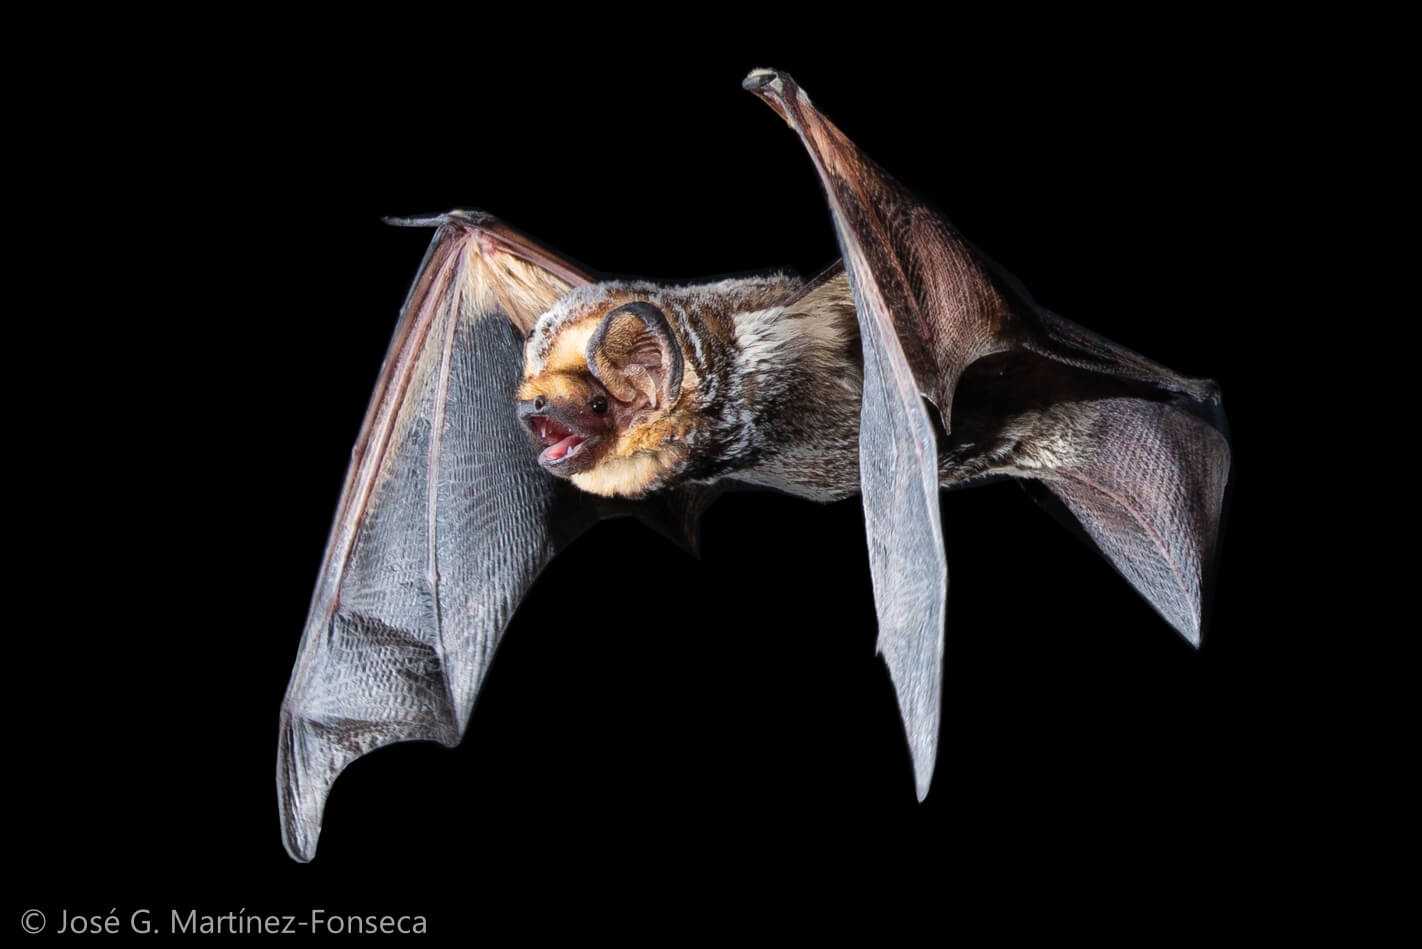
Throughout North America, bats are the primary predators of nocturnal flying insects, providing millions of dollars in pest control services annually. Bats occur in nearly every habitat on the continent, from high elevation alpine forests to deserts and neighborhoods within our largest cities.
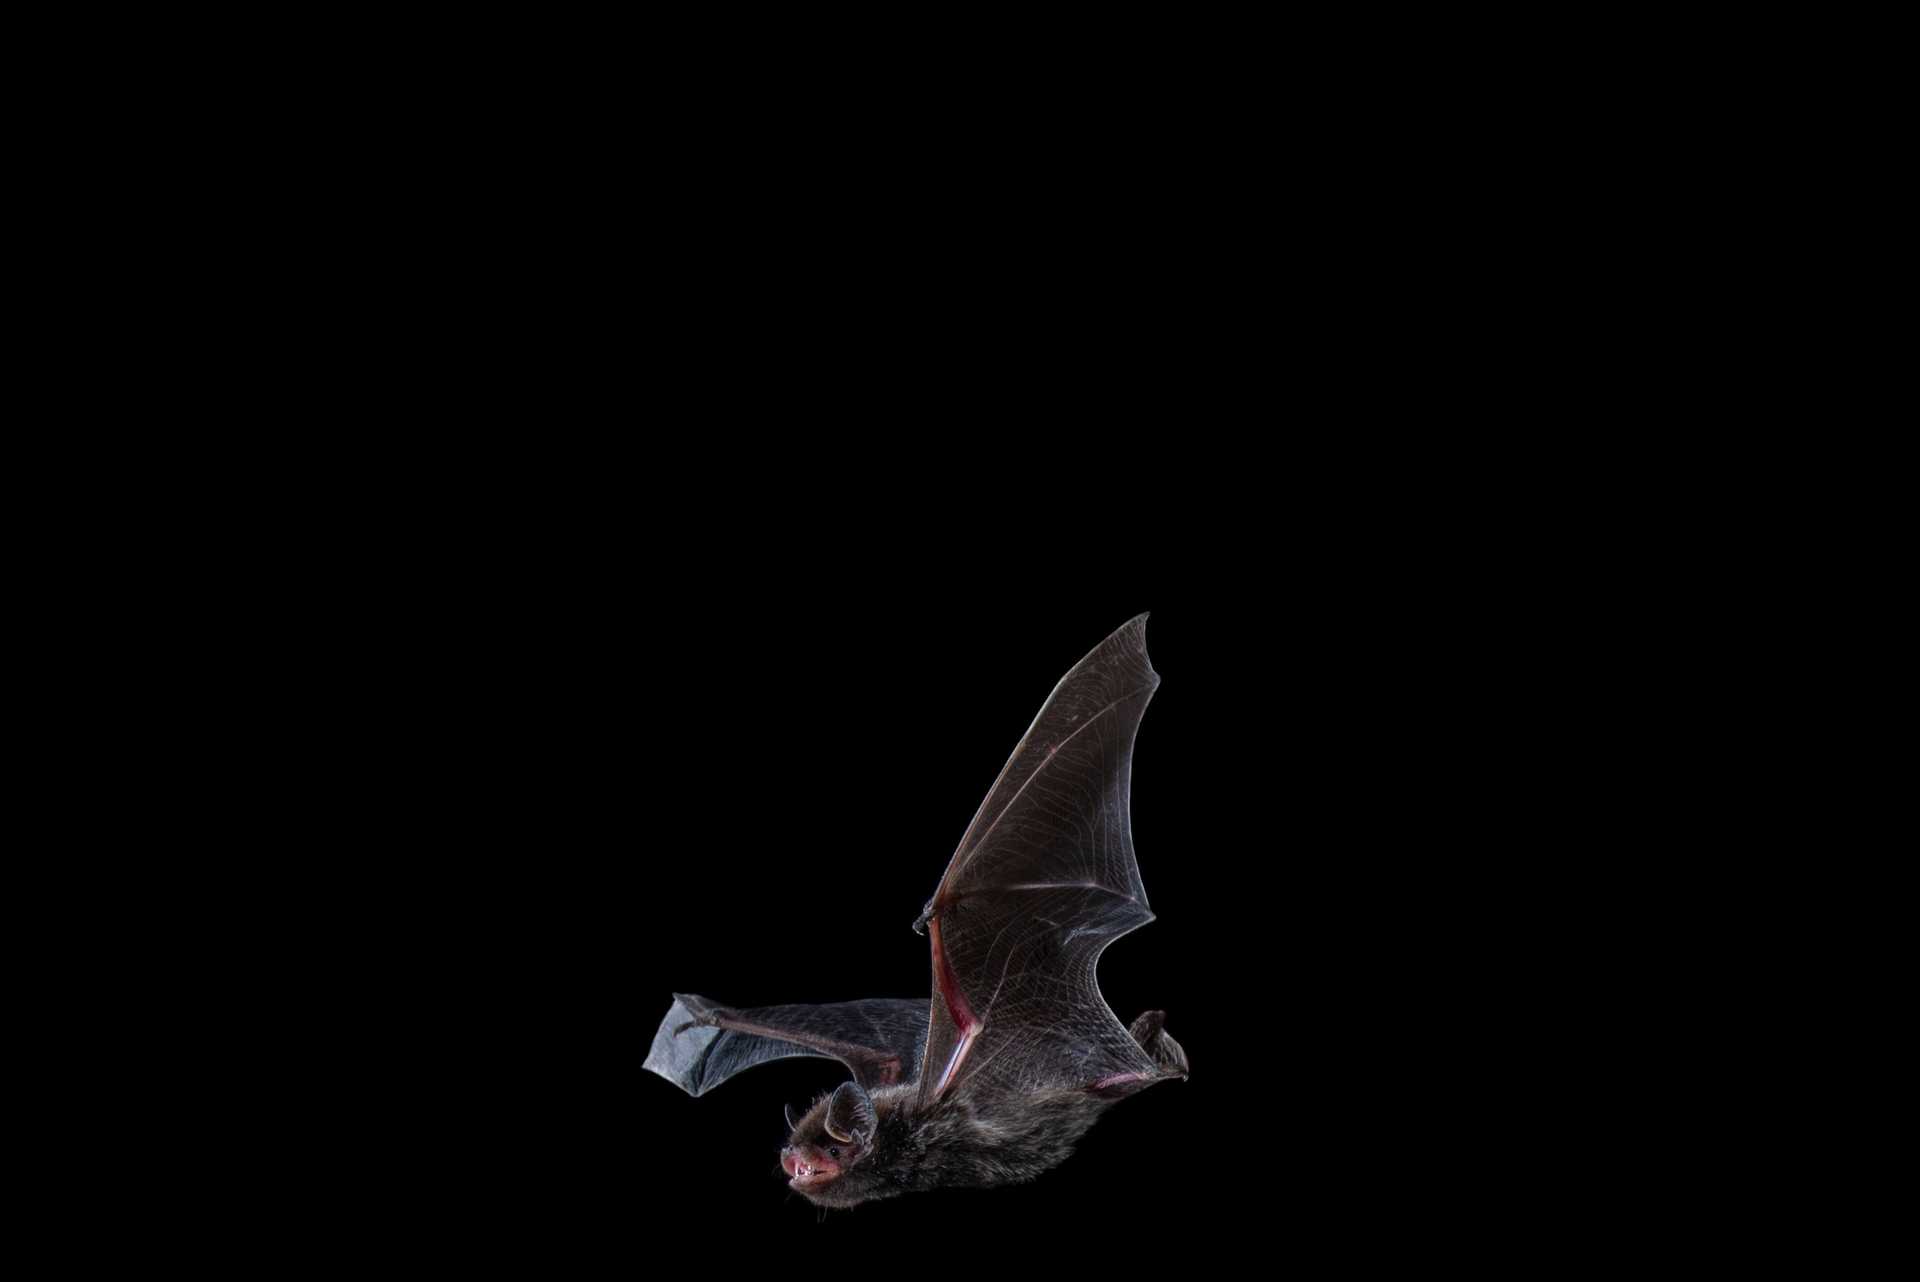
Because bats fly in the dark of night, it is challenging to understand their behaviors and monitor their population status.
To get around this challenge, biologists use bat detectors to better understand bat ecology. These devices record the echolocation calls of nearby bats, and combined with specialized software and expert knowledge, biologists can often identify bat species from these detections. Biologists deploy these detectors for one or more nights at locations across the continent throughout the year, and may monitor presence or activity of various bat species each night.
Bat Acoustic Monitoring Portal
This application is a companion to the Bat Acoustic Monitoring Portal (BatAMP).

BatAMP provides a central platform where biologists can upload their detection data in order to better understand the distribution, seasonal movement patterns, and population status of bats across North America. These data are then compiled for visualization within this tool.
Learn more about how to contribute data to BatAMP.
North American Bat Monitoring Program
This application now includes stationary acoustic monitoring data from the North American Bat Monitoring Program (NABat) that have been shared with BatAMP. NABat is a collaborative bat monitoring effort that integrates data collected by multiple organizations across North America, with a specific focus on aggregating bat monitoring data to inform population status and trends.
To share your data on NABat with BatAMP, simply login to NABat and navigate to your project, edit project details, and add BatAMP as a collaborating organization. You don't need to upload your data again to BatAMP.
Bat Acoustic Monitoring Visualization Tool
This application enables you to explore bat monitoring data for 44 species across North America, allowing you to explore seasonal trends in species detections and explore bat activity for a particular location.
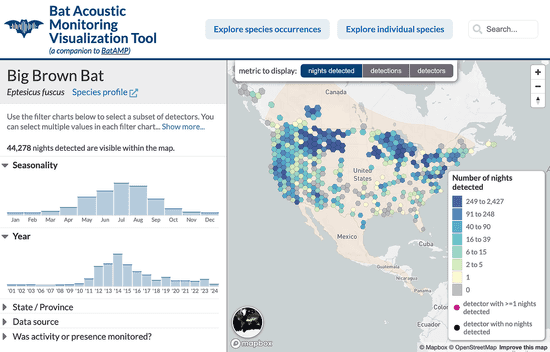
Explore individual species
Explore detailed monitoring data for each of the species included in this application. Each species has a dedicated visualization page that enables you to:
- explore seasonal trends in activity or detections for different locations around North America.
- explore locations where the species has been detected compared to areas where the species was not detected.
- filter the data to explore trends for a given state or province as well as a given time period or season. You are able to combine multiple filters for season, year, state / province, and more.
- view detailed detection information for each bat detector.


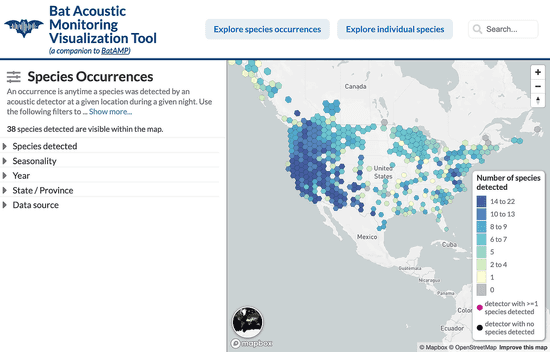
Explore species occurrences
Explore occurrence data aggregated across all species within this application. This allows you to:
- explore trends in species co-occurrence.
- see how many species have been detected at a given location based on sampling effort.
- filter the data to explore trends in co-occurrence for a given state or province as well as a given time period or season. You are able to combine multiple filters for season, year, state / province, and more.
- identify species mis-identification and information gaps.

Made possible by contributors like you
This application leverages the combined efforts of 438 contributors and would not be possible without their hard work. Together, these contributors have collected over 6,977,698 detections of at least 41 species on 287,151 nights using 9,434 detectors.
Top contributors
sort:species detectionsnights monitoreddetectorsspecies detectedon 57,625 nights
using 127 detectors.
8 species detected.
on 33,168 nights
using 273 detectors.
14 species detected.
on 42,001 nights
using 134 detectors.
6 species detected.
on 7,277 nights
using 125 detectors.
5 species detected.
on 13,579 nights
using 32 detectors.
1 species detected.
on 4,816 nights
using 19 detectors.
13 species detected.
And Aaron Haines, Aaron Sidder, Abagail Wetzel, Abby Richardson, Abby Tobin, Adriana Jakobsen, Albert Meerscheidt, Alex Bajakian, Alex Schubert, Allen Calvert, Almeta Helmig, Amanda Adams, Amanda Chandler, Amanda McGarry, Amber Willis, Amy Gaddy, Amy Hammesfahr, Amy Wray, Anabel Lereculeur, Andy and Isaiah Eastlake, Angelica Mendoza, Angie McIntire, Ann Berkley, Annemarie Prince, Anthony Gray, Antoinette Sitting Up Perez, Anya Metcalfe, April Damanti, Ashley Egan, Ashlynn Pryal, Barbara Erlandson, Barbara Williams... Show more...
This project was initially developed by Brendan C. Ward at the Conservation Biology Institute (CBI), now with Astute Spruce, LLC, in partnership with Ted Weller at the U.S. Department of Agriculture Forest Service - Pacific Southwest Research Station.


This project is also supported in part by the California Department of Fish and Wildlife through a U.S. Fish and Wildlife Service State Wildlife Grant.